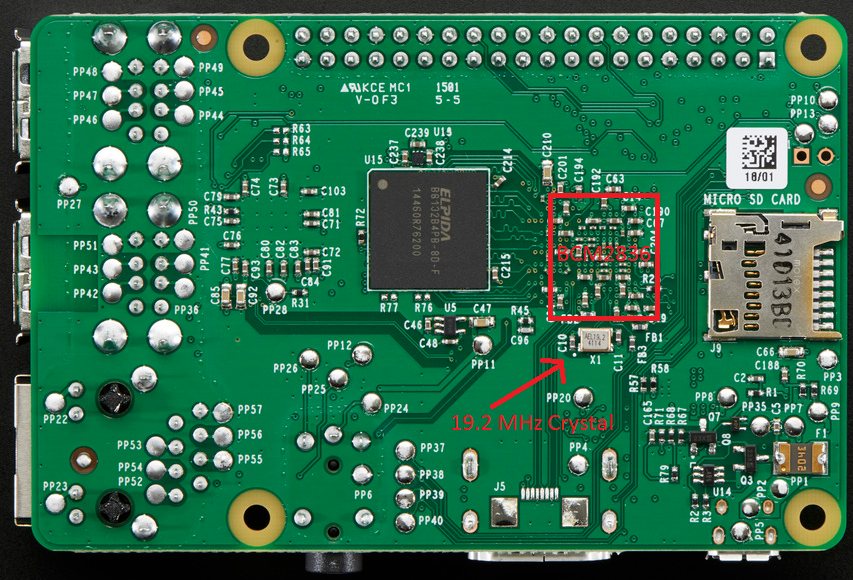
The Raspberry Pi2 only has a single 19.2 MHz crystal on board, driven by the Broadcom BCM2836.
The combo USB/Ethernet chipset (LAN9514) receives a synthesized 25 MHz clock from the BCM2836. Without a broadcom datasheet or source code for the bootloader, it is assumed to be synthesized with a whole integer PLL.
To enable a 9.6 MHz crystal derived clock on pin 7 of the IO header, one can do the following:
sudo gpio mode 7 clock
sudo gpio clock 7 9600000
The 9.6 MHz clock is assumed to be synthesized as simply Fosc/2, however it may be PLL’d.
To load the CPU one may perform the following:
factor 99999999999999999999999999999999999999&
factor 99999999999999999999999999999999999999&
factor 99999999999999999999999999999999999999&
factor 99999999999999999999999999999999999999&
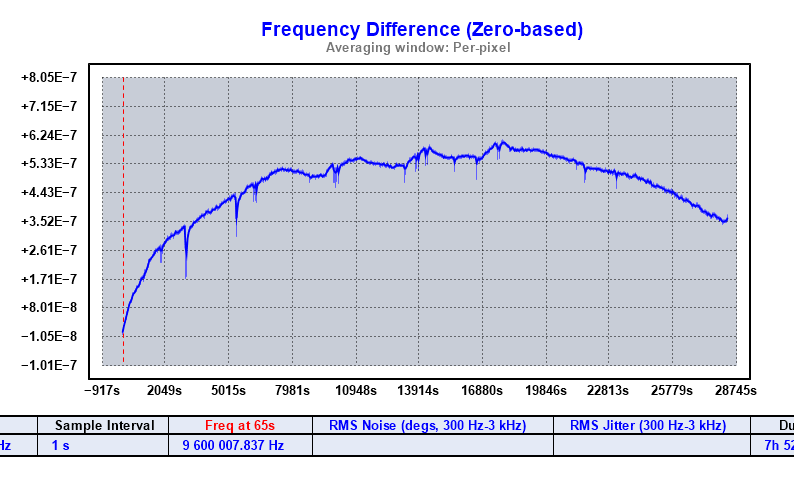
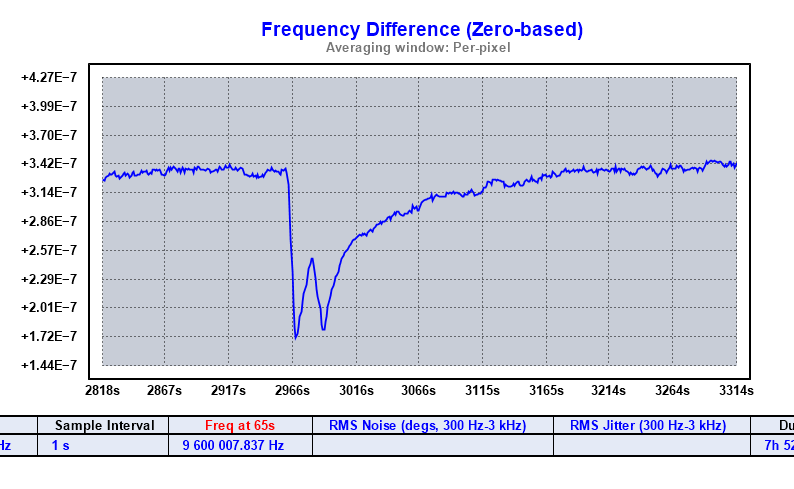
Trial 1
With the RPI in an approximately idle load state (default background process with a desktop flavor of Raspbian) the frequency of the 9.6 MHz clock is measured with a HP 53131A counter. The normalized frequency over time is plotted below.
Trial 2
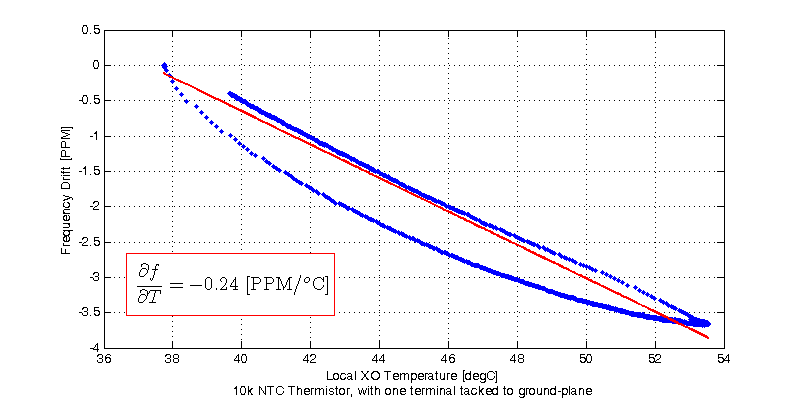
All crystal oscillators have some temperature coefficient, which almost always is the greatest source of error effecting an XO’s short to medium term stability (100 ms to 100 s). In this second trial a 10 kOhm NTC thermistor is added in close proximity to the crystal X1. One of the thermistor’s terminals is tacked to the groundplane, the other terminal has a 30 AWG sense lead attached. The second sense lead is soldered to the groundplane in close proximity to the thermistor. Resistance of the thermistor is monitored with an HP 34401A. After letting the DUT presoak in ambient air with an idle processor load, heavy CPU load is triggered with the factor command, as outlined above. Loading the GPU and CPU with floating point operations would likely cause the BCM2836 to dissipate the most power, however without a datasheet, it is trial and error to determine. Regardless, the factor command instantiated 4 times, caused the board temperature to rise by approximately 15 degC. The board temperature local to the XO and normalized frequency drift is plotted below.
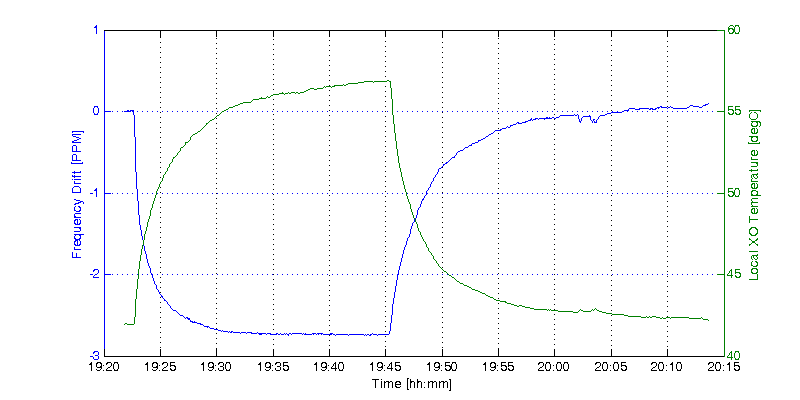
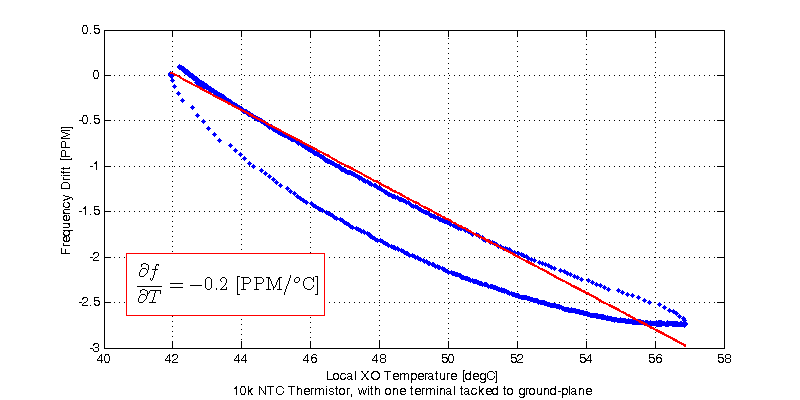
Note that the thermal time constant from the processor to XO (\( \tau_{p2xo}\)), is smaller than the time constant of processor to thermistor (\( \tau_{p2therm}\)), resulting in some phase discrepancy during the rising thermal ramp. However both the XO and thermistor experience similar thermal time constants to ambient during the cooling ramp. A least-squares fit of the full data set is shown below. The approximate temperature coefficient was estimated as -0.2 PPM/degC.
Trial 3
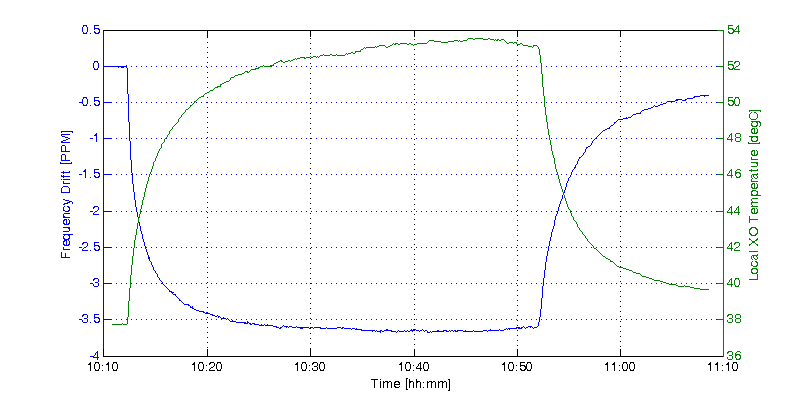
Identical in setup and procedure to that of Trial 2, with the exception of waiting a longer duration with the processor at full load. Temperature and normalized frequency over time is plotted below.
A first order least-squares fit of the full data set is shown below.