Continuing on from the analysis presented in low-noise-high-psrr-ldo-transconductance-gm-block, a simplistic trans-conductance amplifier can be constructed as shown in the figure below.
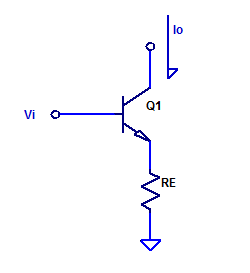
Forward trans-conductance from \( V_i \) to \( I_o \) was shown to be approximately,
$$ g_m = \dfrac{1}{R_E} \;\;\; \text{[A/V] } $$
For evaluation purposes, a \(g_m\) of 1 mA/V is chosen arbitrarily. The resistance of Re is then simply,
$$ R_E = \dfrac{1}{g_m} = 1 \; k\Omega $$
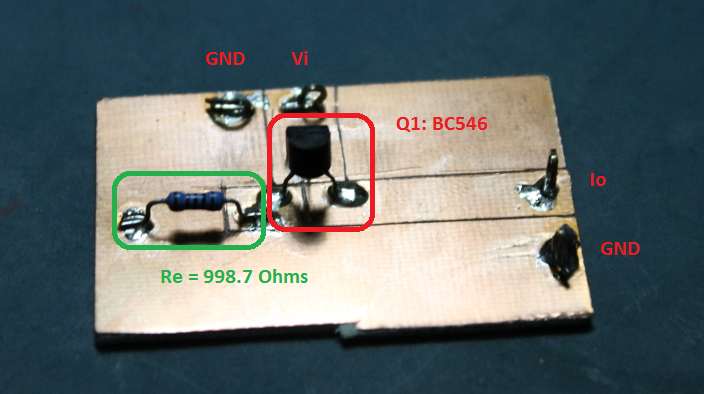
Emitter resistor Re is selected as a \( 1 \; k\Omega \) metal film axial through hole resistor.
Resistor Re was measured for resistance using a 4-wire setup, its value was determined to be:
$$ \text{Re}: 998.65 \;\Omega $$
Transistor Q1 is selected as a BC546, based having existing stock on hand.
DC current gain of Q1 was measured as the ratio of \( I_C / I_B \), using \( I_C = 4.4 \; mA \) as test load point. The current gain of Q1 was measured as:
$$ \beta = 275 $$
Construction of the gm-amplifier is done on a single layer copper clad FR4 board.
Measurement Setup
A wiring diagram of the measurement setup is shown in the figure below.
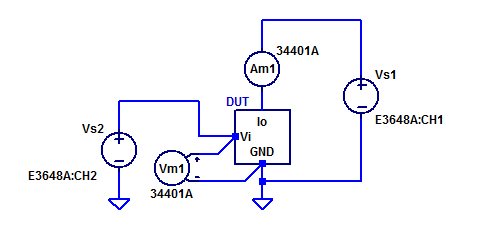
The DUT’s collector potential is biased for nominally 12 V, via bench power supply Vs1. Output current from the gm amplifier is measured with ammeter Am1. Control input voltage is measured with voltmeter Vm1.
Bench supply Vs1 is programmaticly steped from 0 VDC to 5 VDC in 50 mV steps.
Measurement Results
The V-I response of the gm-amplifier is shown in the figure below.
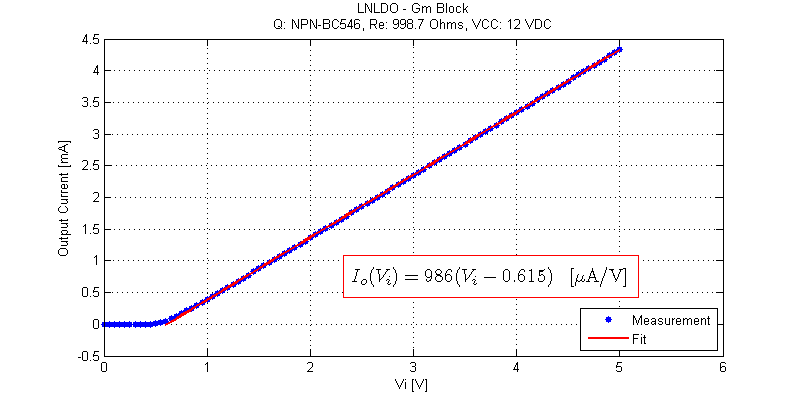
Note the 615 mV offset voltage due to Vbe turn on of Q1. I-V slope of 986 uA/V is also slightly lower than 1/Re.
Linearity of the gm-amplifier is shown in the figure below.
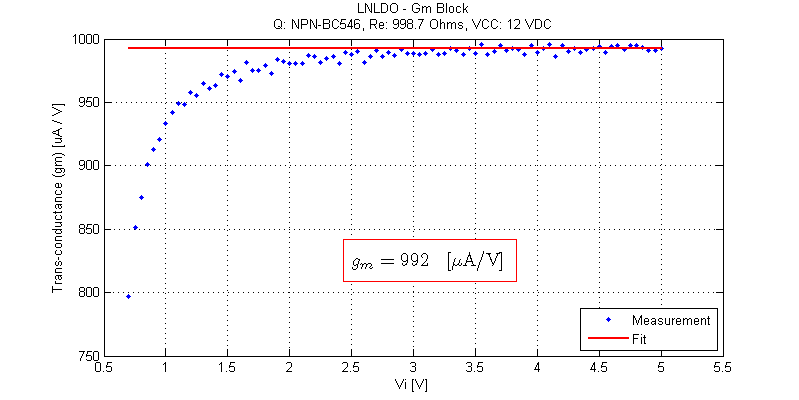
Near the turn-on voltage of Q1 of \( \approx 600\) mV, \(g_m\) linearity is poor. However for inputs greater than 2 V, \( g_m \) stabilizes to 992 uA/V.
The small-signal model parameters of Q1 are as follows,
\begin{align*}
Ic &= 4 \text{ mA}\\ \\
Vt &= \dfrac{ KT}{q} = 25.2 \text{ mV}\\ \\
g_m,q &= \dfrac{I_c}{V_t} = 158.7 \text{ mA/V}\\ \\
r_\pi &= \dfrac{\beta}{g_m} = 1733 \;\Omega \\
\end{align*}
Finally the amplifiers \(g_m\) is then,
$$ g_m = \dfrac{ \beta }{ r_\pi + ( 1 + \beta)R_E } = \dfrac{275}{1733 + (1+275)998.7} = 991.4 \text{ [uA/V]}$$
Raw Data
The measurement data can be found as a csv file below:
File is formatted as,
Input Voltage [V], Output Current [A]