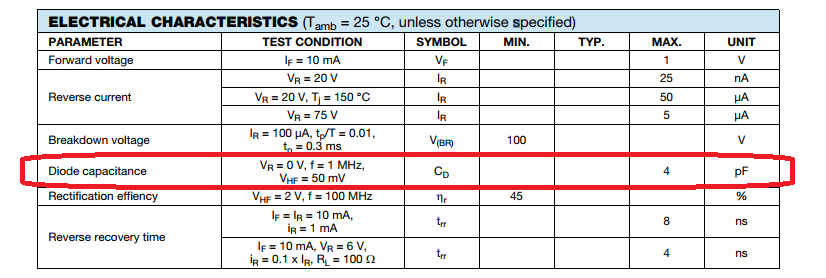
Most of the datasheets from assorted suppliers of a 1N4148 diode all guarantee a maximum diode capacitance of 4 pF at \(V_D\) = 0 VDC. A sample excerpt from the Vishay datasheet has the \(C_D\) specification circled in red.
Some suppliers provide the typical total diode capacitance versus reverse bias potential, and some suppliers don’t. Two sample specifications from Fairchild and Renesas datasheets are shown in the figure below.
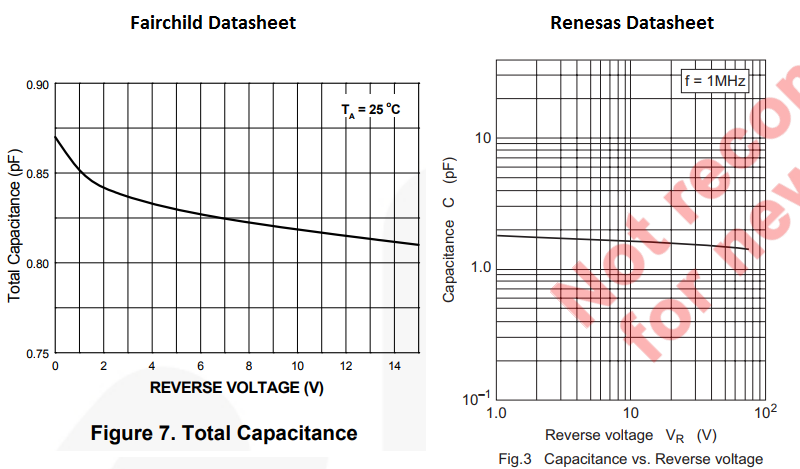
Both datasheets depict a 1N4148 having a low voltage coefficient on total capacitance.
Assorted 1N4148 datasheets all have a different specification for reverse-biased capacitance:
Vishay 1N4148, Renesas 1N4148, Fairchild 1N4148, Diodes 1N4148, NXP 1N4148
Measurement Setup
The excitation signal used in many low cost handheld capacitance meters can be up to 2 Vpp. In order not to forward bias the diode junction the diode must have a reverse bias voltage which is at least equal to the magnitude of the test signal. Resolution of a low cost capacitance meter is also only typically 0.1 pF on the lowest range (at least for my meter).
To allow for a smaller excitation signals and higher measurement resolution a custom impedance test-jig is constructed. A simplified schematic of the test setup is shown in the figure below.
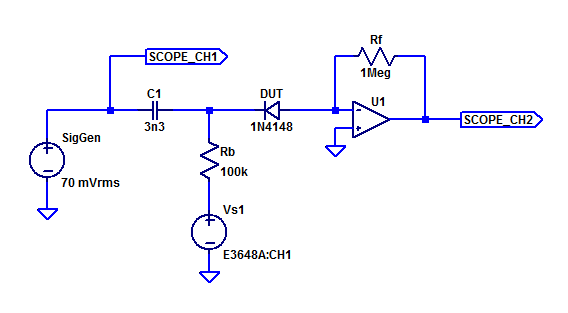
A test tone \(V_T\) is AC coupled via \(C_1\) to the DUT. Bench supply \(V_{s1}\) provides the reverse DC bias for the DUT. Bias Resistor \(R_b\) is chosen to be large enough to not overload the impedance of \(C_1\) while at the same time have minimal \(IR\) drop from the DC reverse bias current of the DUT. Amplifier \(U_1\) and feedback resistor \(R_f\) form a trans-impedance amplifier with a gain of \(-1 \;V / 1\; \mu A\).
As the test frequency increases, the impedance of the DUT decreases (capacitor) yielding a larger test current signal. However U1 is a generic op-amp (MCP601) with a 2.8 MHz gain-bandwidth product. To maximize the test current signal, but still main maintain a reasonable amount of loop-gain for U1, a test frequency of 10 kHz is chosen. A photo of the impedance test-jig is shown below.
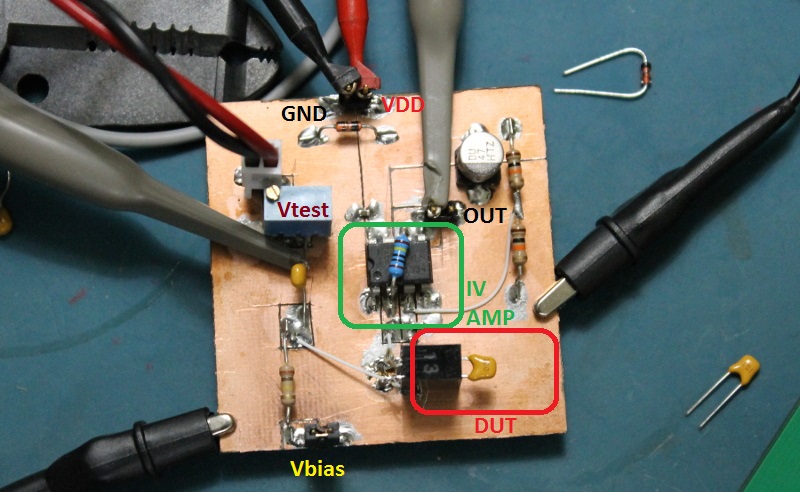
Spot testing with a 10 pF capacitor, yields good agreement with a handheld capacitance meter. The results from 100 sequential measurements of a 10 pF sample capacitor is shown in the figure below.
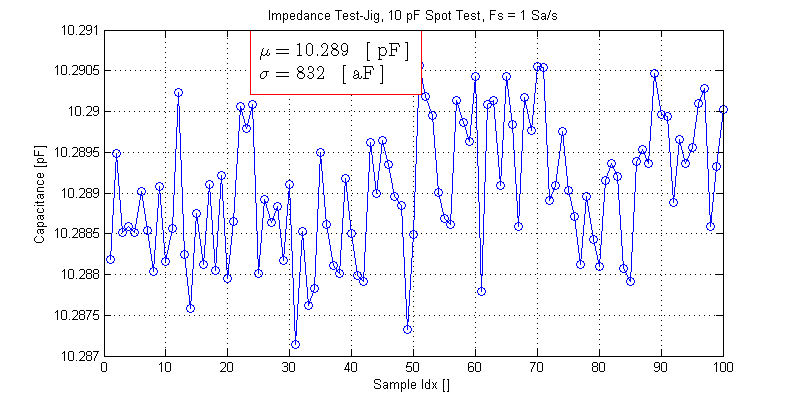
The spot test sample capacitor yielded an average value of 10.289 pF.
Measurement of the test capacitor in a low-cost handheld capacitance meter can be seen in the photo below.
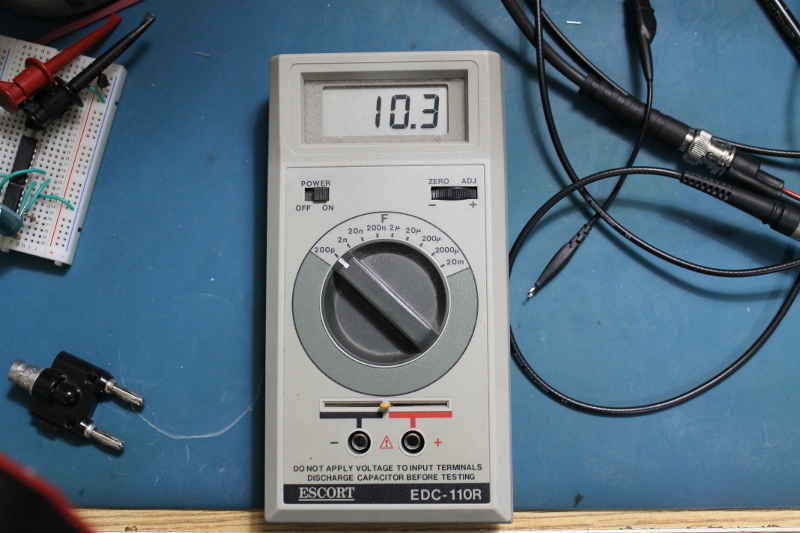
The Escort EDC-110R does not have a NIST traceable calibration certificate, hence, its fair to assume both measurement techniques have equivalent scale errors (perhaps \(\pm 1 \%\)).
At low reverse bias voltages a 1N4148 has significant shunt conductance, it isn’t until -1 V that the diode enters a “Constant \(I_s\)” leakage region where the parallel shunt resistance is in the gigaOhm region. A Spice IV sweep of a 1N4148 from -20 mV to 20 mV is shown in the figure below.
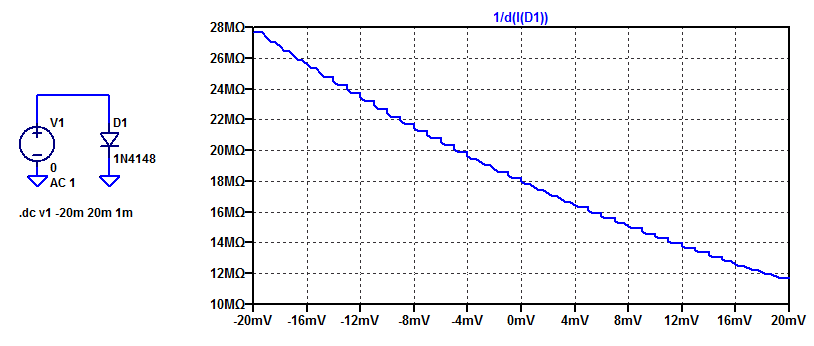
We can see that at 0 VDC a 1N4148 diode has a shunt resistance of 18 MOhms. Contrast this resistance to the capactive reactance of the 1N4148 at 10 kHz as,
$$ X = \dfrac{-1}{2\pi \cdot 10 \text{ kHz} \cdot 2 \text{ pF}} = -7.96 \text{ M}\Omega $$
Since the magnitude of the resistance is comparable to the reactance at some test voltages, the rms of the current signal cannot be assumed to be solely due to the capacitance of the diode. Hence, complex phasor analysis must be applied. One must sample the real/imaginary portions of the current signal (or measures the phase and compute the real/imaginary components) and estimate the capacitance based on the imaginary current.
When the diode is biased at 0 VDC, during the negative cycle of the excitation signal the DUT is forward-biased. In the figure below the resulting signal distortion from the DUT rectifying the test signal can be observed.
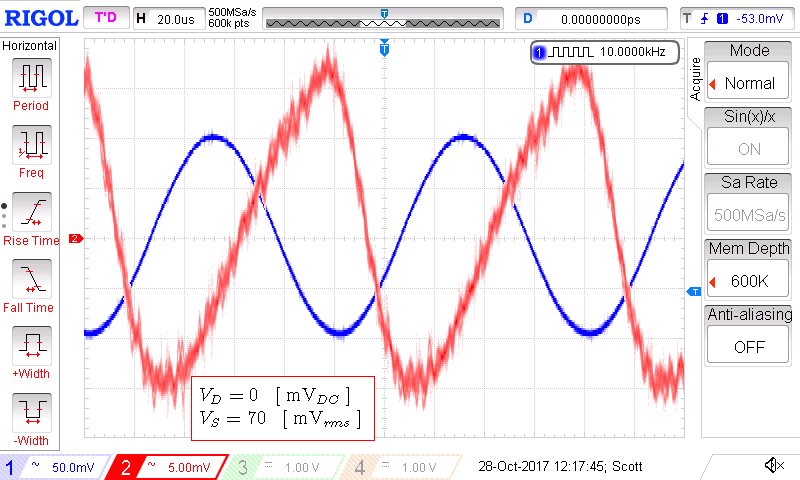
However, once the DUT is reverse biased at -100 mVDC, it no longer can rectify the 100 mVpk excitation signal. A scope capture of the excitation and current signal at -100 mVDC reverse bias is shown below.
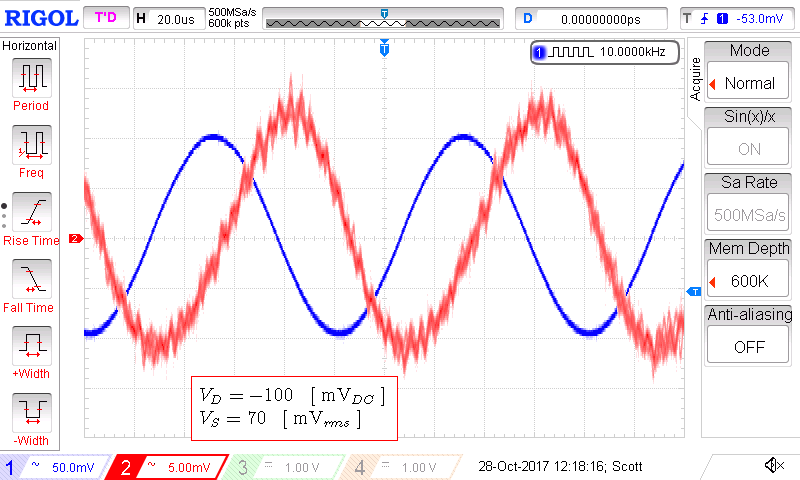
The resulting sensed current signal is sinusoidal plus noise and leads the excitation signal by \( \approx 90 ^o\). Note that the output current signal has a \(180^o\) phase shift from the inverting response of the trans-impedance amplifier. Consequently the actual test capacitor current lags the excitation voltage by \( 90^o\).
Measurement Results
Attempting to measure the 0 VDC capacitance with a low-cost capacitance meter yielded mixed results. With a single DUT only one orientation yielded a capacitance measurement. With 2 DUTs in apposing polarity a plausible measurement result is obtained. All three DUT orientations are shown in the figure below.
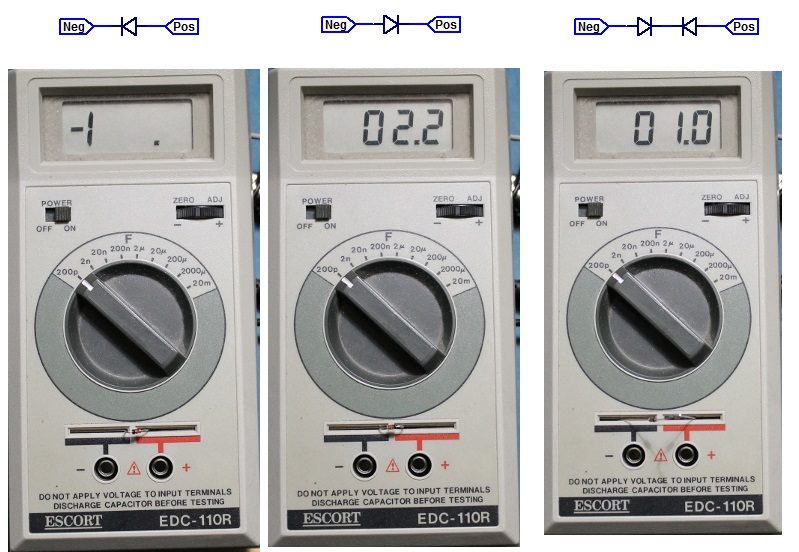
If we assume all diodes have the same \( C_0\) capacitance, then for the third test arrangement, a single DUT’s capacitance is,
$$ C_D = \dfrac{C_1 + C_2}{C_1C_2} \simeq 2 C = 2.0 \; \text{ pF} $$
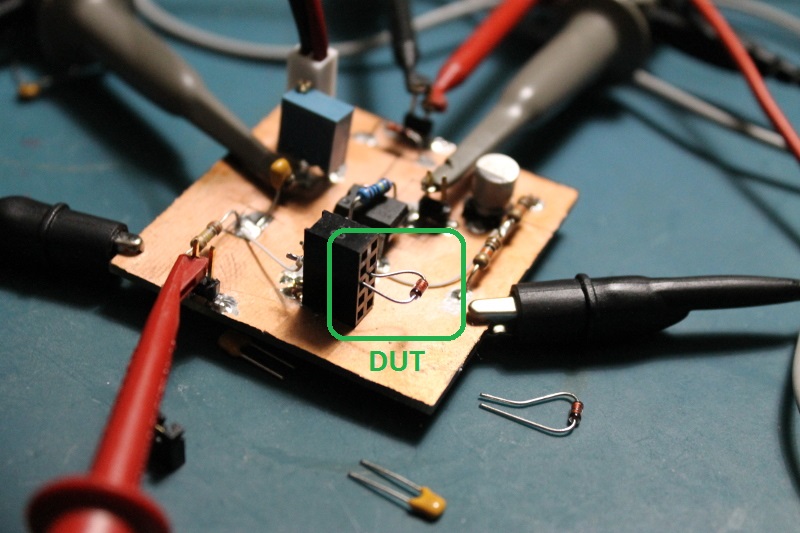
Each of the 4 1N4148 DUTs are loosely lead formed and inserted into the test-jig as shown in the photo below.
The total capacitance \(C_D\) of 4 1N4148 diodes versus reverse bias potential is shown in the figure below.
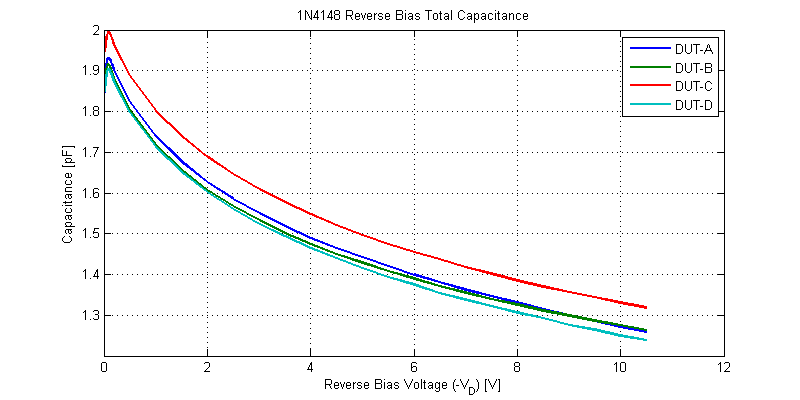
Each of the 4 sample diodes tested were within 100 fF of each of the other samples for the same reverse bias voltage.
For bias voltages less than -100 mV, the test drive tone partially forward biases the DUT. Measurement results near 0 VDC are shown in the figure below.
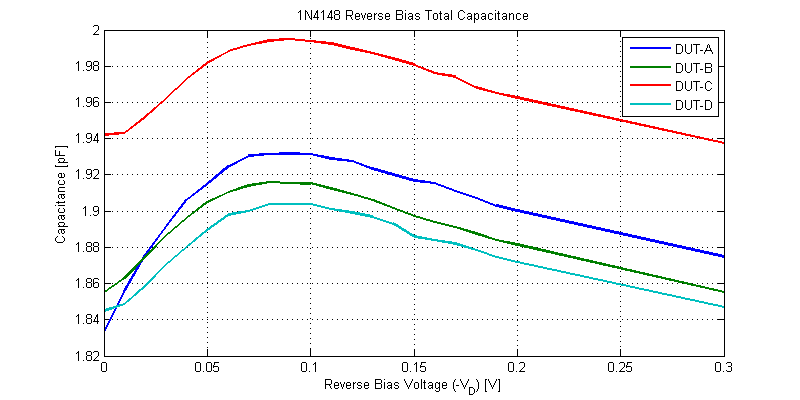
Half-wave rectification adds harmonic power anti-phase to the reactive current of the DUT; resulting in a slight decline in estimated DUT capacitance.
Some portion of the total diode capacitance \(C_D\) is do to the stray capacitance between the leads of the diode. To qualify the approximate value of lead shunt capacitance two separate \(\approx 15\; mm\) leads were inserted into the 100 thou pitch test header. A photo showing a sample DUT and the sample leads is shown in the photo below.
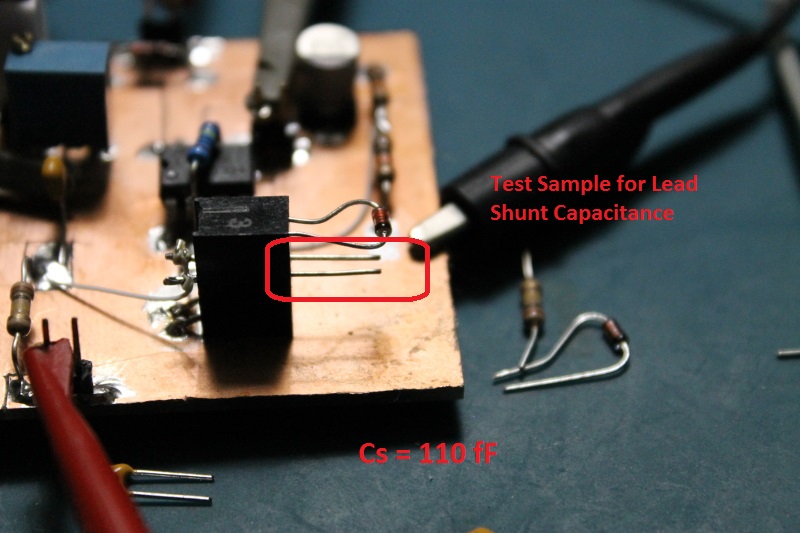
The 15 mm test leads yielded an approximate capacitance of 110 fF. Measurement results for the test leads is shown in the figure below.
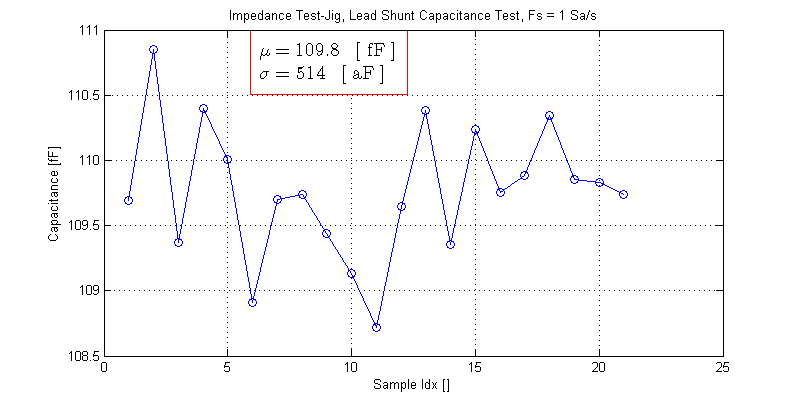
In reality the lead length (far too long) and spacing (far too close) yield a conservative figure for lead shunt capacitance. With the total capacitance ranging from 1 pF to 2 pF the axial leads only make up 5 to 10 % of the total capacitance.
The remaining capacitance for reverse biased operation is the actual depletion capacitance of the diode junction and the shunt capacitance due to the glass body of the diode.
Raw Data
The measurement results for the 4 DUTs are available as a csv file below.
The CSV file is formatted as,
Vbias [V],Ca [F],Cb [F],Cc [F],Cd [F]
This is one of those rare bits of information you can’t find in the datasheets or textbooks, thanks!