In this post a sample schmitt-trigger relaxation oscillator is constructed and instrumented.
Measurement Setup
A simplified schematic of the test setup is shown in the figure below.
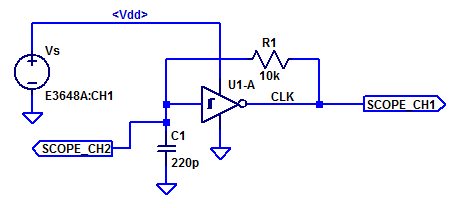
A simple relaxation oscillator is constructed with a CD40106 schmitt-trigger inverter. Bench supply \(V_s\) is stepped programatically from 0 to 20 VDC in 100 mV steps. The output clock signal is probed with a 10x probe to a DS1054Z oscilloscope. The hardware frequency counter in the scope is employed to measure the oscillation frequency. Wave measurement function ‘PDUTY’ is used to measure the duty cycle of the output clock signal. Integration capacitor C1 is probed with a 10x probe to channel 2 of the DS1054Z. Measurement function ‘VMIN’ is employed to measure the negative threshold voltage \(V_N\). Measurement function ‘VMAX’ is employed to measure the positive threshold voltage \(V_P\).
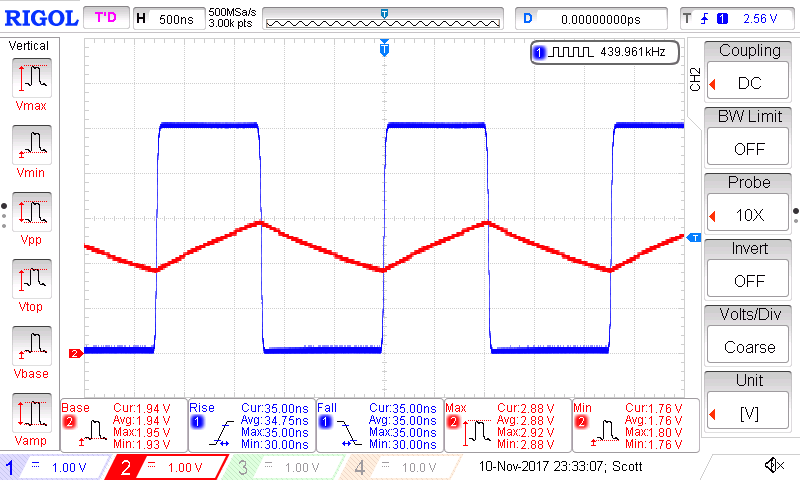
A scope capture of the test oscillator is shown in the figure below. Channel 1 and 2 are connected to the test oscillator as shown in the test schematic above.
The rise/fall time of the CD40106 is quite slow, with a its typical specification being 100 ns @ \(V_{dd} = 5} VDC. A scope capture of a falling clock edge is shown in the figure below. A fall-time of 28 ns when loaded with a 10x probe is better than the specification in the datasheet.
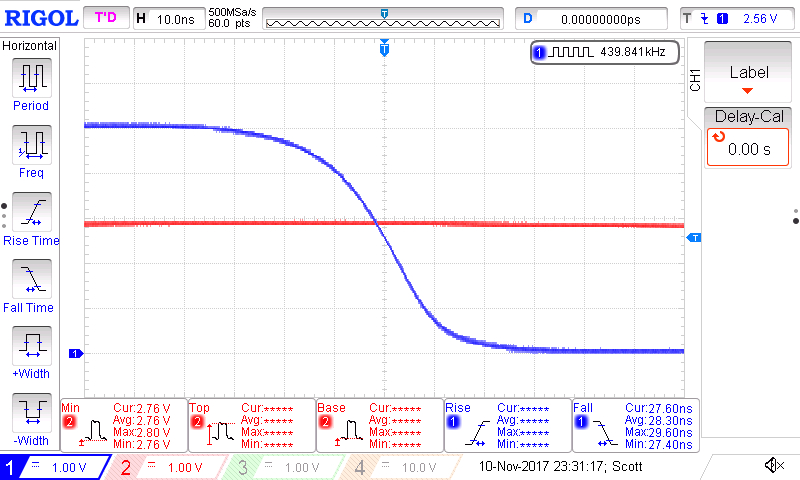
A 10x probe may have a effective input capacitance of 10 pF to 15 pF. Assuming the Cd40106 has a drive strength of approximately 5 mA the rise/fall time driving a capactive load of 50 pF which is limited exclusively by drive strength would be,
$$ t_f = \dfrac{(0.9V_{dd}-0.1V_{dd}) C_L}{I_O} = \dfrac{4 \text{ V} \cdot 50 \text{ pF}}{5 \text{ mA}} = 40 \text{ ns} $$
Contrasting that with the fall-time measured on the test oscillator the drive strength of the output pin would be
$$ I_O = \dfrac{0.8V_{dd} C_L}{t_f} = \dfrac{ 4 \text{ V} \cdot 15 \text{ pF}}{28 \text{ ns}} = 2.1 \text{ mA} $$
A scope capture of the rising edge of the clock signal is shown in the figure below.
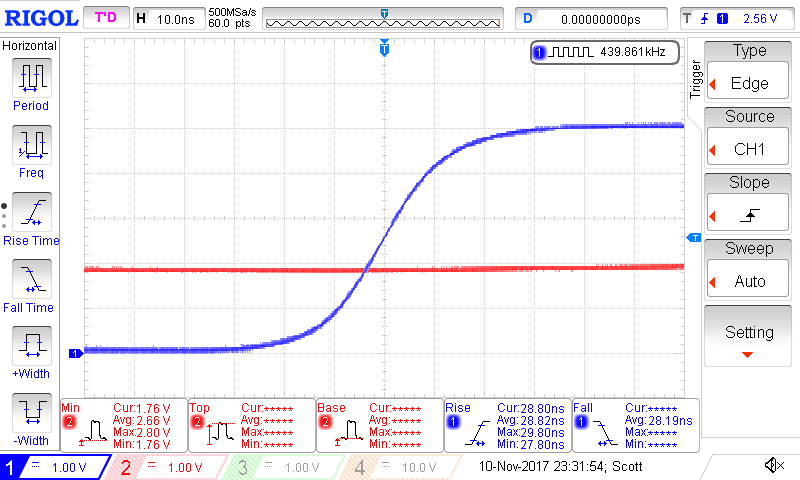
The rise time is approximately equal to the fall-time at 29 ns.
Measurement Results
$$ R_1 = 9.98 \text{ k}\Omega, \;\;\; C_1 = 230 \text{ pF} $$
The MIN/MAX measurement functions of the DS1054Z are used to measure the threshold voltages as seen by capacitor C1.
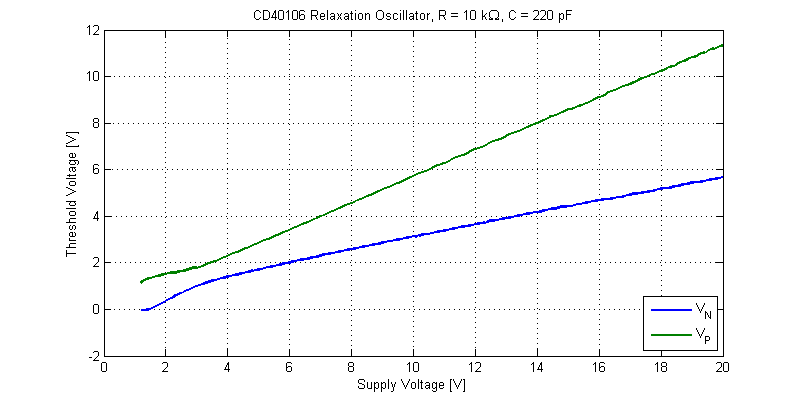
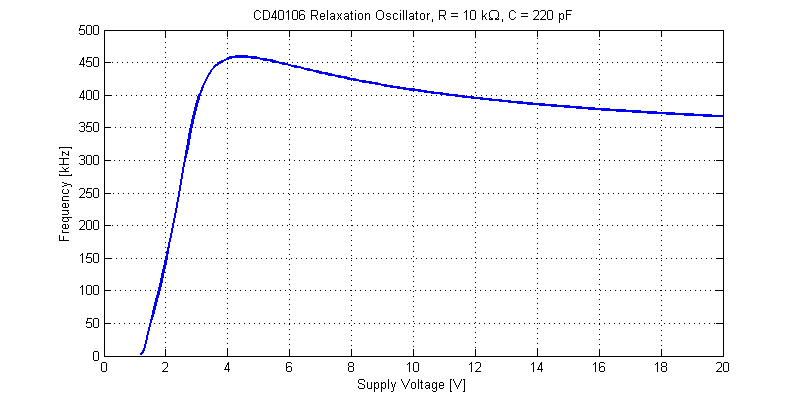
The frequency of oscillation versus supply voltage is shown in the figure below.
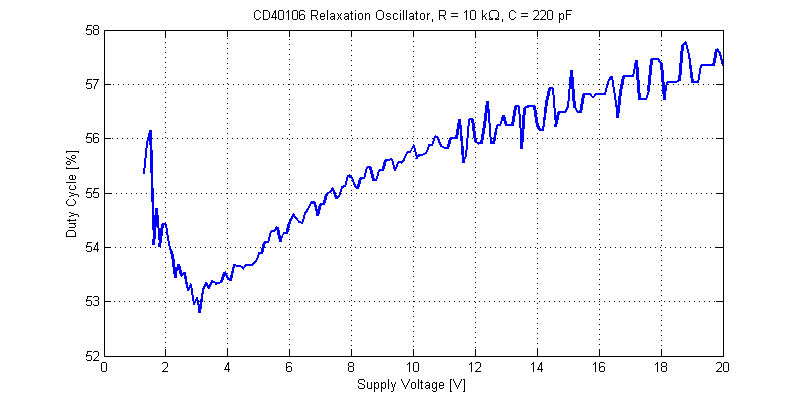
The DS1054Z appears to only use the 1200 sample point screen buffer for measurement functions, resulting in poor resolution of the duty cycle measurement. The figure below provides the duty cycle of the output clock signal.
From the post: “cd40106-schmitt-trigger-relaxation-oscillator” the two solutions for the oscillation frequency of a schmitt-trigger relaxation oscillator are the following,
$$ f_{RC} = \dfrac{1}{RC \log \left( \dfrac{(V_{dd}-V_N)V_P}{(V_{dd}-V_P)V_N} \right)}$$
$$ f_{constI} = \dfrac{V_{dd}}{4RCV_H} $$
The figure below provides both frequency solutions and the measurement results.
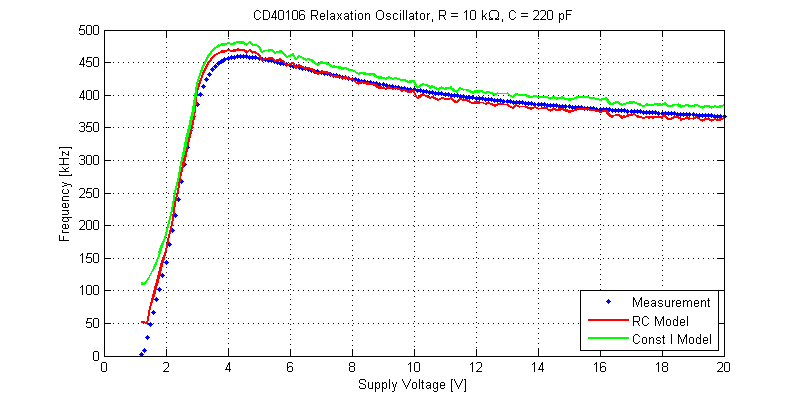 Interestingly, the constant current model still provides reasonable agreement for this particular DUT and R/C combination.
Conclusions
The threshold voltages \(V_N\) and \(V_P\) scale ratiometerically with supply voltage resulting in an approximately constant oscillation frequency from \(V_{dd} = 4\) V to \(V_{dd} = 20 \) V.
From 1.5 VDC to 3 VDC, the oscillator behaves as a linear VCO.
Raw Data
The raw data for the CD40106 relaxation oscillator is provided below.
The CSV file is formatted as,
Vdd [V],Vn [V],Vp [V],Fosc [Hz],DutyCycle []
Hello, About the CD40106BE Schmitt Inverter Oscillator, we use 1 inverter (pin1/pin2) only, or we connect pin2 with pin 3?