In this post, the charge profile of a Panasonic N-700AACL NiCd battery will be instrumented.
The two recommended termination signatures to be used when fast-charging NiCd cells are either negative \(\Delta V\) or positive dT/dt. Thermal detection is more challenging to implement as one requires good thermal contact between a temperature detector and the cell under charge. In the case of negative \(\Delta V\) one already has the cell potential by the same contacts being used to apply the charge current. However, one requires sufficient measurement precision of the cell under charge to detect the relatively small \( \Delta V\) signature.
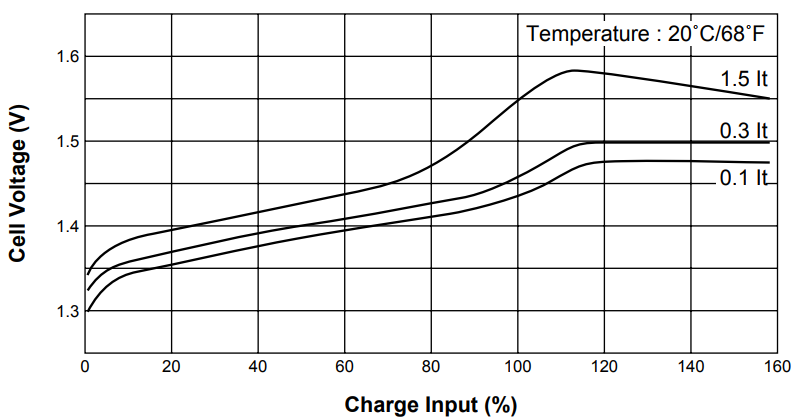
The charge profile of an N-700 cell during various charge rates is shown in the figure below.
For fast-charge currents of 1C and larger we can expect to see a negative \(\Delta V\) signature at approximately 110 % charge. At a 1C rate, 110% charge input is a charge duration of 66 minutes.
Measurement Setup
In order to mitigate ESR of test leads and the batter holder a 4 wire measurement approach is pursued. A schematic of the test setup is shown in the figure below.
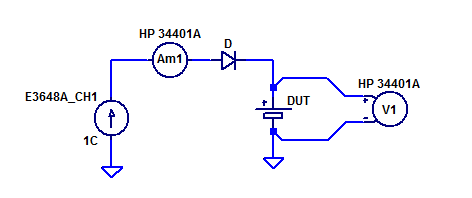
Bench supply \(I_{s1}\) is configured as constant current source of 700 mA. Ammeter \(A_{m1}\) measures the charge current applied to the DUT. Series Diode D protects the DUT from being discharged by the supply if OVP/OCP trips or the supply is misconfigured. Voltmeter \(V_{m1}\) is connected directly to the DUTs terminals with independent sense leads.
Prior to initiating a 1C fast-charge both DUTs were given a 1 mA precharge until the cell potential reached approximately 1.2 VDC.
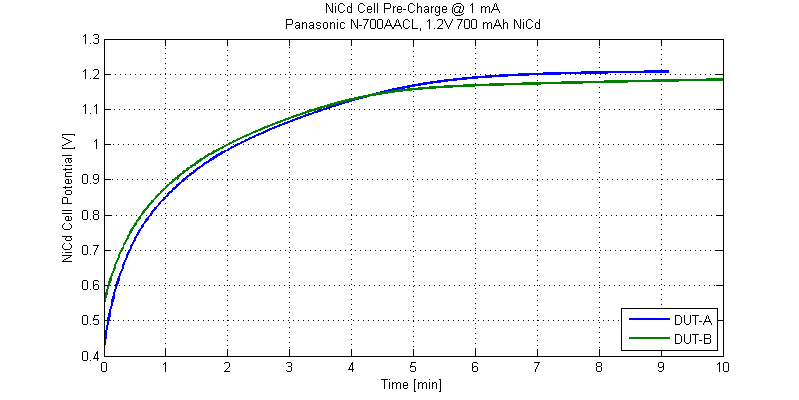
The charge needed to recover a cell back to its nominal potential of 1.2 VDC was 0.014% C.
Measurement Results
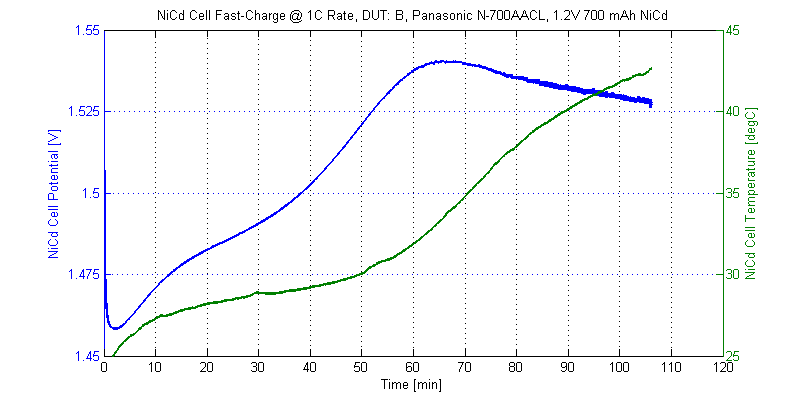
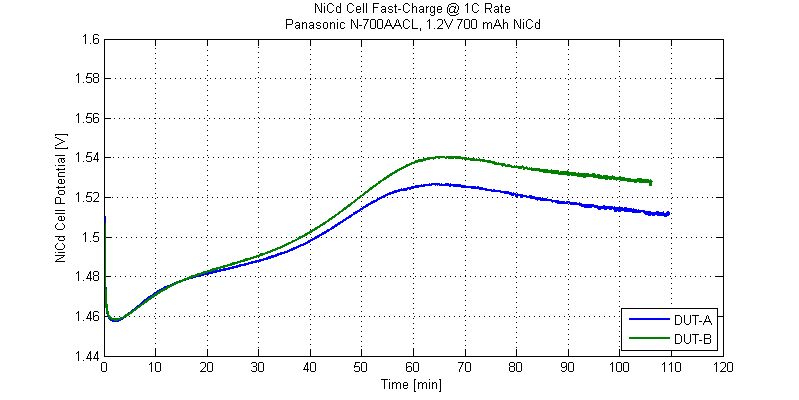
Cell voltage and temperature during a 1 C fast charge of DUT A is shown in the figure below.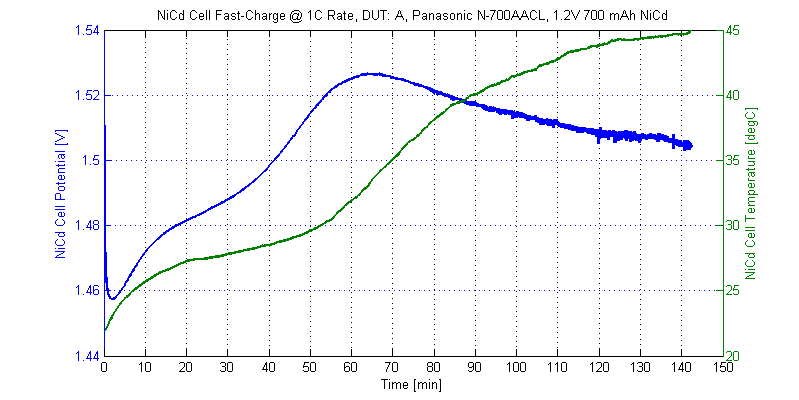
Fast-charge profile of DUT B is shown in the figure below.
Temperature Profile
Both cells displayed a similar thermal profile over the course of a fast-charge cycle. A plot of both DUTs temperature during the charge cycle is shown in the figure below.
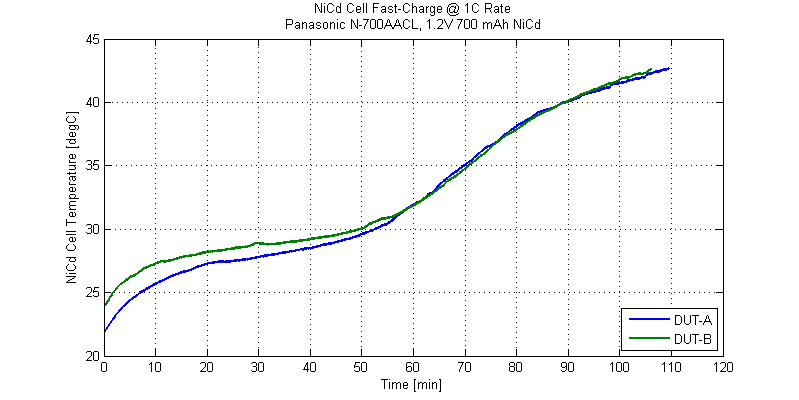
With the exception of the ambient room temperature rising 1.5 degC between charge cycles, the two DUTs display similar thermal profiles while charging.
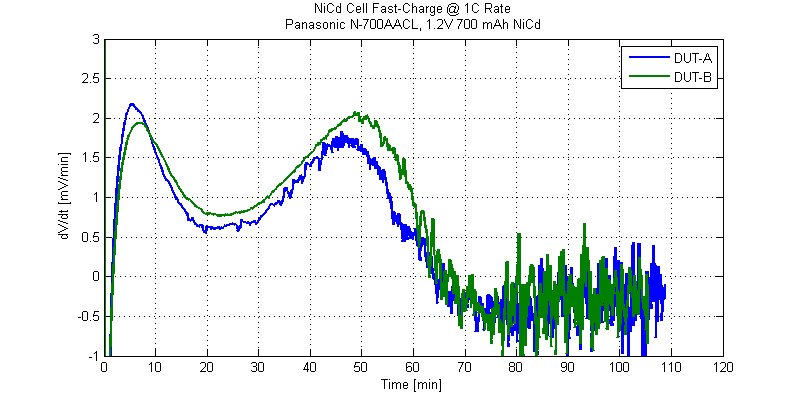
Near the end of a 1C charge cycle, \(\approx 60\) minutes, cell temperature beings to increases significantly compared to the previous 60 minutes. The thermal rate of the DUT is shown in the figure below.
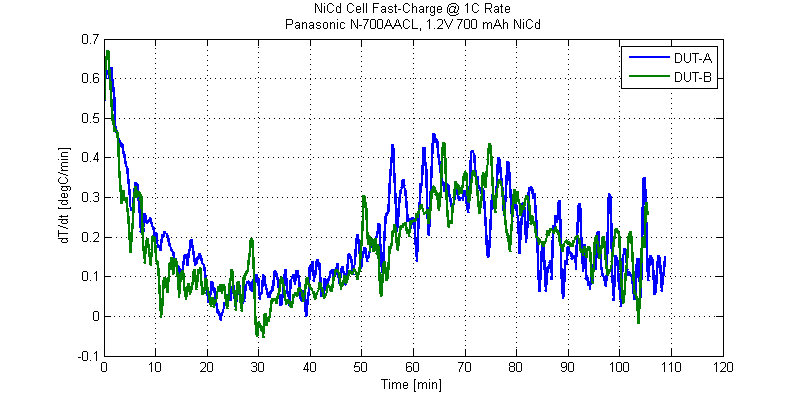
Interesting, the largest dT/dt occurs at the beginning of a fast-charge cycle. For these particular DUTs the thermal termination signatures is a positive dT/dt of 0.3 degC/min.
Initial temperature profile of a cell under fast-charge is shown in the figure below.
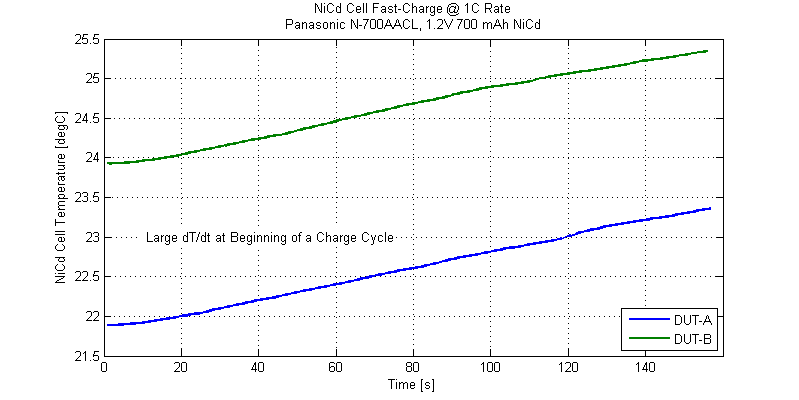
It is believed the temperature rise is due to self heating of the cell’s DCR.
Voltage Profile
During the first 60 seconds of fast-charging a strong negative \(\Delta V\) signature is observed. A plot of cell voltage for the first 2.5 minutes of charging is shown below.
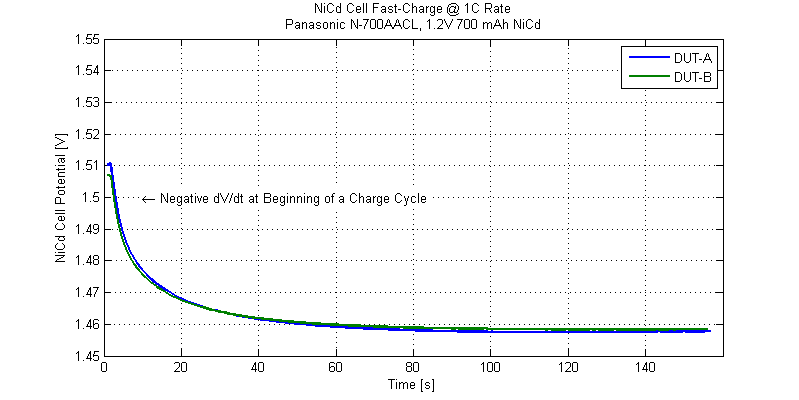
In order to not false trigger on a charge termination signature, a hold-off of 2 minutes is required for these DUTs.
Offsetting both charge profiles to 0 V at peak cell voltage is shown in the figure below.
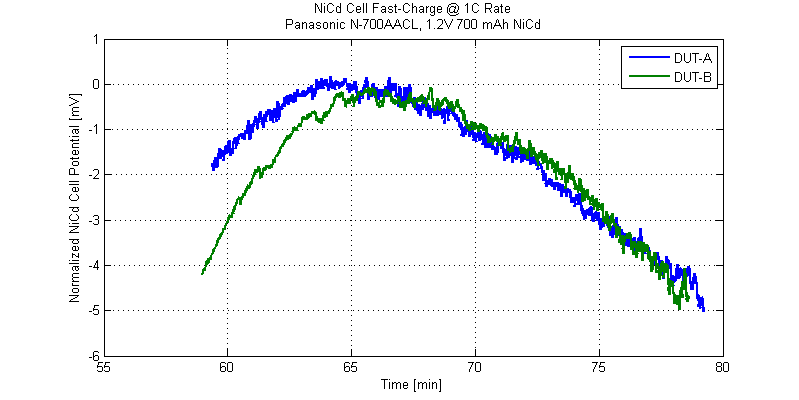
One can observe that the negative \(\Delta V\) signature is fairly small, a decline in cell potential of 3 mV over 10 minutes. For these cells a termination signature of \( \Delta V < 0 \) over few minutes would be ideal. One can also observe small short-term fluctuation in cell potential. Hence measurement of \(\Delta V\) should be done over a time span of 1 minute or greater.
Conclusions
Both cells displayed a large termination profile just after initiating a 1C fast-charge cycle. The largest positive thermal rise \(\partial T/\partial t\) was observed during the first few minutes of charging. The largest decline, negative \(\Delta V/\Delta t\) was observed during the first few minutes of charging. A false termination signal could be observed at the beginning of a charge cycle using either the temperature or voltage termination criterion.
The GP NiCd Handbook also indicates the potential for a false \(\Delta V\) early in the charge cycle:
The most popular quick-charge-termination method
for NiCd batteries is the –dV method. However, after
the batteries have been idled for extended periods
of time, a false –dV signal may occur very early
during the first cycle of charging. This may result in
premature charge-termination.
Raw Data
The raw measurement data from fast-charging two NiCd cells is available as csv files below:
The CSV files are formatted as,
Timestamp [s],Ichg [A],Vcell [V],Tcell [degC]
